

 Australia
  Brazil
  Canada
  Chile
Chile  China
China  Columbia
  Denmark
  Egypt
Egypt  France
  India
India  Indonesia
  Ireland
  Italy
Italy  Malaysia
  New Zealand
  Norway
  Panama
  Peru
Peru  Poland
  Portugal
  Saudi Arabia
  Singapore
  South Korea
  Spain
Spain  Sweden
  Taiwan
  Thailand
  Türkiye
  United Kingdom
  United States
  Vietnam
More than ever, the climate emergency imposes that all new, or retrofitted, infrastructure minimises carbon emissions and is resilient to the changing climate and especially to extreme weather events. SYSTRA has developed tools to help decision-making in addressing these challenges. Sofia Fotiadou, the Group’s Sustainable Design Manager sheds light on the subject.
Human induced global warming is changing our climate at a rate that is unprecedented over millennia. Physical impacts of climate change, such as rising temperatures, changing patterns of precipitation, increased intensity of extreme weather events and sea level rise will increase vulnerability of all types of infrastructure.
There is scientific consensus that avoiding catastrophic climate change requires limiting average global temperature increase due to greenhouse gas emissions to 1.5˚C compared to preindustrial times. According to the Intergovernmental Panel on Climate Change, temperature rise could be limited to 1.5˚C, only if the world substantially reduces emissions in the 2020s and get to net-zero emissions by around 2050.
More than ever, the climate emergency calls for infrastructure that is being consistent with low-carbon transitions, as well as resilient to the changing climate and especially to extreme weather events.
Designing, building, and operating climate-compatible infrastructure means that lifecycle carbon emissions and climate vulnerability impacts are considered from the early stages of the design. This requires using robust methods of quantification that allows identification of hotspots to support informed decision-making around solutions that mitigate, and adapt to, these climate impacts.

Low-carbon infrastructure
Carbon emissions result throughout the lifecycle of an infrastructure, hence designing a climate-compatible infrastructure needs us to take into consideration and minimise carbon impacts linked to materials’ extraction and production, their transport to the construction site, all construction site activities, the operational phase, including maintenance, and finally, the end-of-life and decommissioning of the infrastructure.
The lifetime of transport infrastructure extends to several decades, often more than 100 years, yet the majority of lifecycle carbon emissions are “locked-in” during the design phase; hence largely dependent on design decisions. Clearly, it is of paramount importance that carbon is considered from the early design stages and that designers have the information on the carbon impact of the design solutions they are considering in real time with the design, so that they can select and prioritise low-carbon solutions in compliance with the carbon reduction objectives of the project.
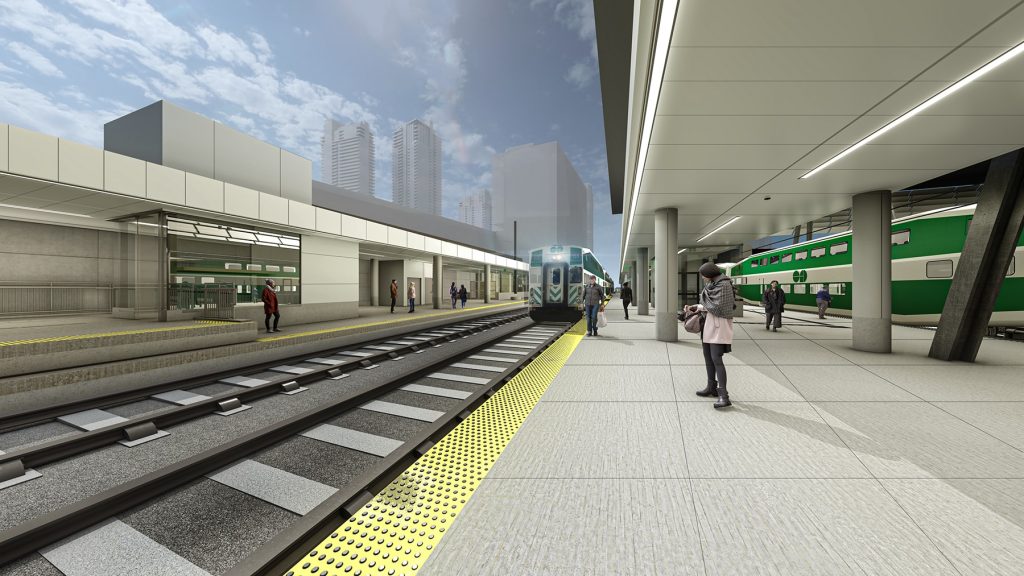
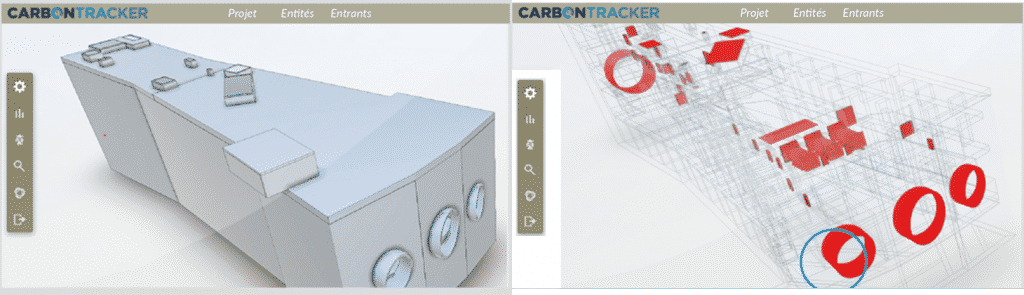
To address this challenge, we developed CARBONTRACKER, a web application that can help engineering teams integrate lifecycle carbon from the early design stages and throughout the entire design and construction process of an infrastructure. The application is BIM compatible and is specifically designed for transport infrastructures (railway/tramway, highway, cable car system, etc) including all related buildings (stations, depots, technical installations, etc).
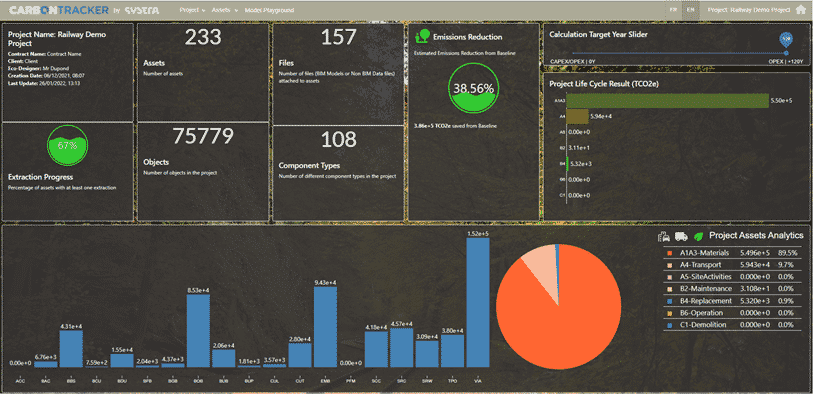
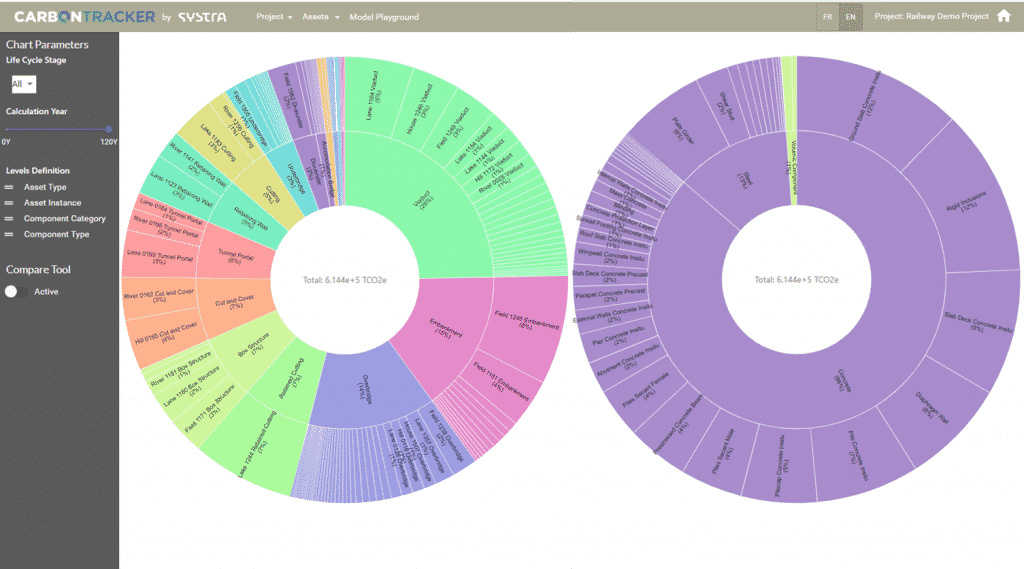
The tool helps us measure the carbon impact at different levels of granularity, from the asset level to project level, identify carbon hotspots, run sensitivity analysis, test alternative solutions and various design scenarios that can reduce lifecycle carbon emissions, as well as assess progress towards project carbon reduction targets. Most importantly, the entire process can take place in real time with the design to help informed decision making and ensure the design is considering the carbon impact along with other project requirements, such as cost, durability, safety, technical performance, etc.
One of the main contributors to the development of this tool was Lucas Gibaud, BIM and Data Engineer.
Climate resilient infrastructure
Infrastructure should be designed and constructed in a way that anticipates and adapts to changing climate conditions. Taking as a reference historic trends and past extremes weather conditions (flooding, heatwaves, etc.) might not be sufficient for developing infrastructures with lifetimes that extend to several decades ahead, as the ongoing climate change tends to continuously intensify extreme weather events.

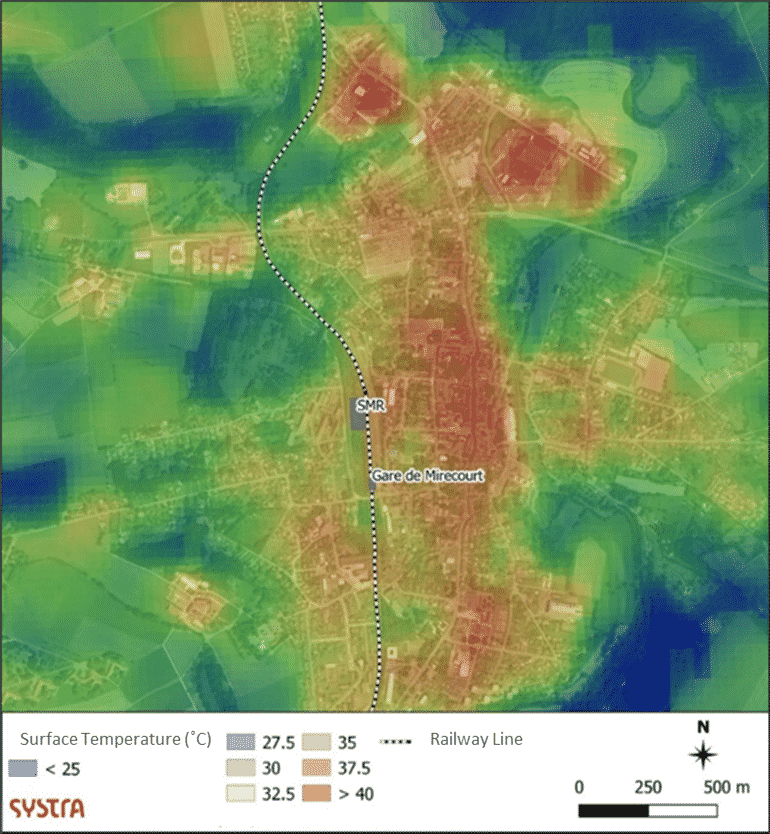
Moreover, intensive urbanisation and lack of urban planning in many metropolitan cities of the world are creating microclimates, due to phenomena such as the urban heat island, which are enhanced by global warming creating conditions of discomfort for the people living and working in these areas, especially during seasons with high ambient temperatures.
To better understand future climatic conditions and risks at the scale of a transport infrastructure project, we developed a climate data visualization mapping tool, CLIMATEplus, that makes possible to identify the areas of vulnerability of our project area in terms of the evolution of extreme episodes of heat, precipitation and winds, in the short, medium and long term (up to 2100).
CLIMATEplus uses climate data and projections of the Intergovernmental Panel on Climate Change (IPCC), which are based on scenarios related to the different levels of concentration of greenhouse gases resulting from human activity in the atmosphere. They therefore represent the possible futures of the climate.
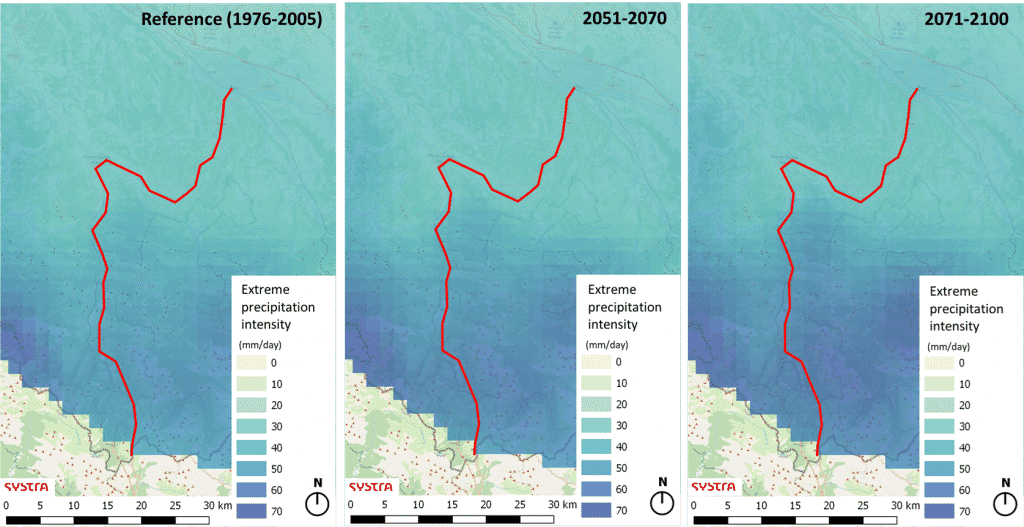
CLIMATEplus allows us to exploit regional climate projection databases from multiple models by interpolating, over our project area, several climate indicators to visualise their trend according to different greenhouse gas emissions scenarios and thus assess the vulnerability of the infrastructure over time.
We have integrated an additional function to the tool, in order to map microclimates within urban areas, largely linked to the heat island effect. For this function, CLIMATEplus imports surface temperature from satellite data to provide maps that present the different levels of temperatures within urban areas during summer days with high observed temperatures.
CLIMATEplus was developed with the valuable contribution of Robin Goix, Transport Planning Consultant and Data Engineer.
__________________________________
The long lifespan of infrastructure assets means that design and development decisions made now will lock-in a certain amount of carbon emissions, as well as climate vulnerability, if they do not consider these impacts from the onset of their concept design. At SYSTRA we work closely with our discipline experts to address these challenges and design infrastructures that contribute to the race against climate change.