

 Australia
  Brazil
  Canada
  Chile
Chile  China
China  Columbia
  Denmark
  Egypt
Egypt  France
  India
India  Indonesia
  Italy
Italy  Malaysia
  New Zealand
  Norway
  Panama
  Peru
Peru  Poland
  Portugal
  Saudi Arabia
  Singapore
  South Korea
  Spain
Spain  Sweden
  Taiwan
  Thailand
  Türkiye
  United Kingdom
  United States
  Vietnam
 Data is powerful and influential. But it can also be complex, confusing and inaccessible.
To truly harness the benefits of a varied and multi-input data stream it’s crucial to present it in a format that users can derive clear outputs from.
It’s why SYSTRA’s Data Science Team has worked so diligently to create an effective and efficient dashboard framework aimed at supporting decision makers and strategy planners.
Transport for the North’s (TfN) visualisation framework has been a collaborative effort to deliver a package that can be rolled out universally and help showcase key opportunities for infrastructure improvements across communities.
What is the visualisation framework?
The framework is a full-stack, open-source and low-cost dashboarding solution built entirely from scratch. Rather than relying on expensive proprietary enterprise software, our teams developed a bespoke system designed specifically for the nuanced needs of transport and infrastructure planning.
The technology stack includes:
- A custom React library (vis-core) that serves as the template for building applications, featuring componentry for interactive charting and map-based visualisations using vector tiles and the maplibre-gl library.
- A .NET web API, which is currently being translated into a core library and template for easy deployment.
- A PostgreSQL database build from the ground up to work directly with the framework out of the box, complete with built-in authorisation and vector tile capabilities.
- Python-driven data load processes.
Because the framework is built on open-source technology, it offers exceptional value for public sector clients by avoiding recurring enterprise licensing fees. It also allows for a high degree of customisability for clients with specific requirements. This solves the common pain points of building consistent visualisations and providing a seamless web-based access to stakeholders across different locations.
Clients can visualise complex scenarios spatially and over time. This includes exploring rail and highway modelling outputs, projecting Electric Vehicle (EV) uptake, or examining the impacts of different policy scenarios for business cases.
Comparatively, it means very low cost to deploy whilst outputting high quality visuals to the web.
How was the visualisation created?
A significant challenge in creating these visualisations is the raw data itself. It is produced in countless ways, arriving in various file formats, from disparate sources, and with varying levels of normalisation.
For our Data Science Team, the primary task was developing consistent schemas that minimise repetition, optimise performance and maintainability, and establish robust long-term processes upstream.
A clear example of this Extract, Transform, Load (ETL) process was our work on the Strategic Analysis apps for the Northern Powerhouse Rail (NPR) business case. Data was flowing in from a large number of distinct analytical processes, workstreams and analysts. It required rigorous cleaning and normalisation to maximally exploit the commonalities between all the different data sources; transforming a complex web of information into a unified data model.
The visualisation framework in action – Transport for the North
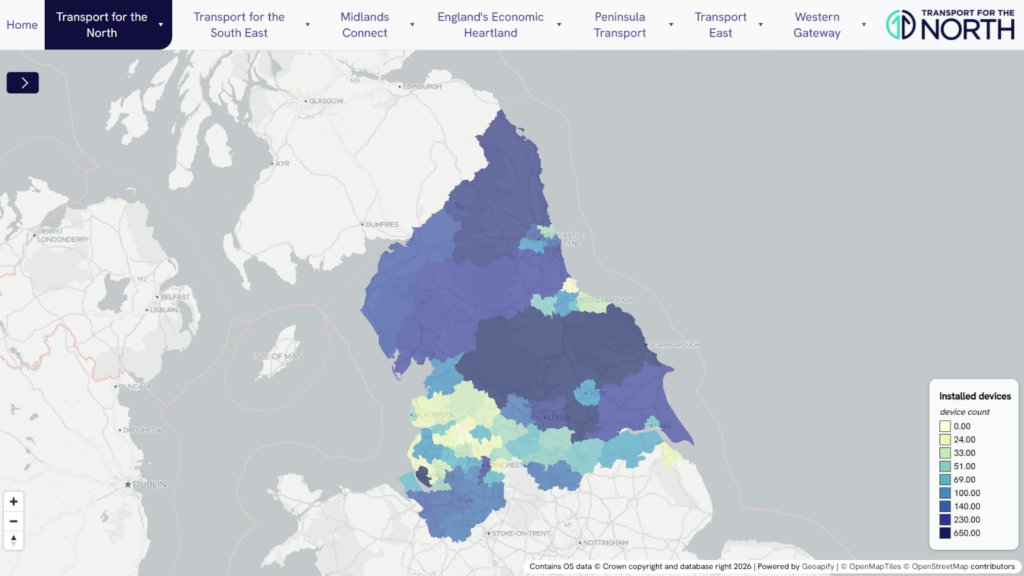
We’re really pleased to be able to put the data together as a connected platform to help others do their own analysis.
TfN required a solution to a common public sector dilemma. They were paying high licence fees for third-party tools that lacked the flexibility of an in-house solution and did not have the right mix of capabilities to suit their spatial and transport data. As a public sector body, TfN wanted to generate long-term value from their investment, rather than paying rent for software.
SYSTRA developed the Visualisation Framework from the ground up, but it is fundamentally TfN’s platform. We worked hand-in-hand with TfN throughout the process. This collaborative approach focused on upskilling their internal team to maximise the framework’s potential and build the in-house expertise necessary to maintain and develop the tools long term.
The platform fits seamlessly into the TfN Offer, a tiered system providing, at its heart, self-serve access to TfN’s data, analytics and tooling. The rollout empowers users to conduct their own analysis across a suite of bespoke tools:
- Climate Vulnerability Tool (CVT) — helps LADs assess the vulnerability of road and rail networks to climatic risks, meeting Green Book climate change requirements for local transport plans
- Northern Powerhouse Rail (NPR) Strategic Analysis – showcases business case evidence, visualising user benefits, wider economic impacts, air quality, noise, severance, and accessibility impacts across different strategic rail investment scenarios
- Electric Vehicle Charging Infrastructure (EVCI) Visualiser (link https://evci-visualiser.transportforthenorth.com/) – projects EV charging requirements, likely demand, CO2 savings and potential charging sites under different scenarios for Sub-National Transport Bodies (STBs) across England.
- Transport-Related Social Exclusion (TRSE) (link https://trse.transportforthenorth.com/) and Severance tools (https://severance.transportforthenorth.com/) – outline the vulnerability of specific areas to social exclusion and highlight severance risks regarding access to education, health and key services.
- Strategic Rail – pulls together metrics about the rail network, including accessibility, facilities, loadings, performance and congestion
- Transport Model Visualisation (NoHAM, NoRMS) – intended for modellers and other specialists, these tools visualise highway and rail model inputs and outputs, enabling model QA and the direct comparison of different scenarios.
What is the future development of data and the visualisation framework?
The primary target audience for this approach includes those local and regional bodies (e.g. Local Authorities, Combined Authorities and other public sector organisations) where cost control and data ownership are particular priorities. The framework offers a transition away from static reports and spreadsheets, toward interactive, shareable web dashboards they can manage themselves.
SYSTRA provides the expertise in understanding data architecture and how it all fits together. Our specialists can help clients set up the infrastructure to build an entire stack from the ground up.
Looking ahead, our roadmap includes fully open-sourcing the framework, including API libraries, templates and bootstrapping, so clients can build this out on their own infrastructure. We will also continue to enhance the breadth of visualisation capabilities within the tool to widen the offer for future users.
The code is free to access and our experts are ready to help you build a bespoke, cost-effective data/visualisation infrastructure.
- services
Data Science and Visualisation
Read more sur Data Science and Visualisation
- services
Digital Solutions and Software Development
Read more sur Digital Solutions and Software Development- services