

Visualises the climate vulnerabilities of infrastructure.
With climate change, historical data are no longer sufficient to anticipate future climate conditions as extreme events become more intense and more frequent.
Infrastructures are already threatened, and annual costs could surge in the future. Cross-referencing historic data with climate projection models for the future and asset sensitivities is key to identifying infrastructure vulnerabilities. Adaptation requires striking the optimal balance between investing in resilient design, avoiding future damage and maintaining service performance.
ClimateViz is a web application designed to visualise and analyse the vulnerable assets of your project in the face of climate change, and to prioritise adaptation measures. By cross-referencing historical data with projection models, the evolution of vulnerabilities can be anticipated over the long term.
The solution supports adaptation decision-making by identifying the most exposed assets to each climate risk, the locations of vulnerable assets, and assessing vulnerabilities for long term horizons.
Features
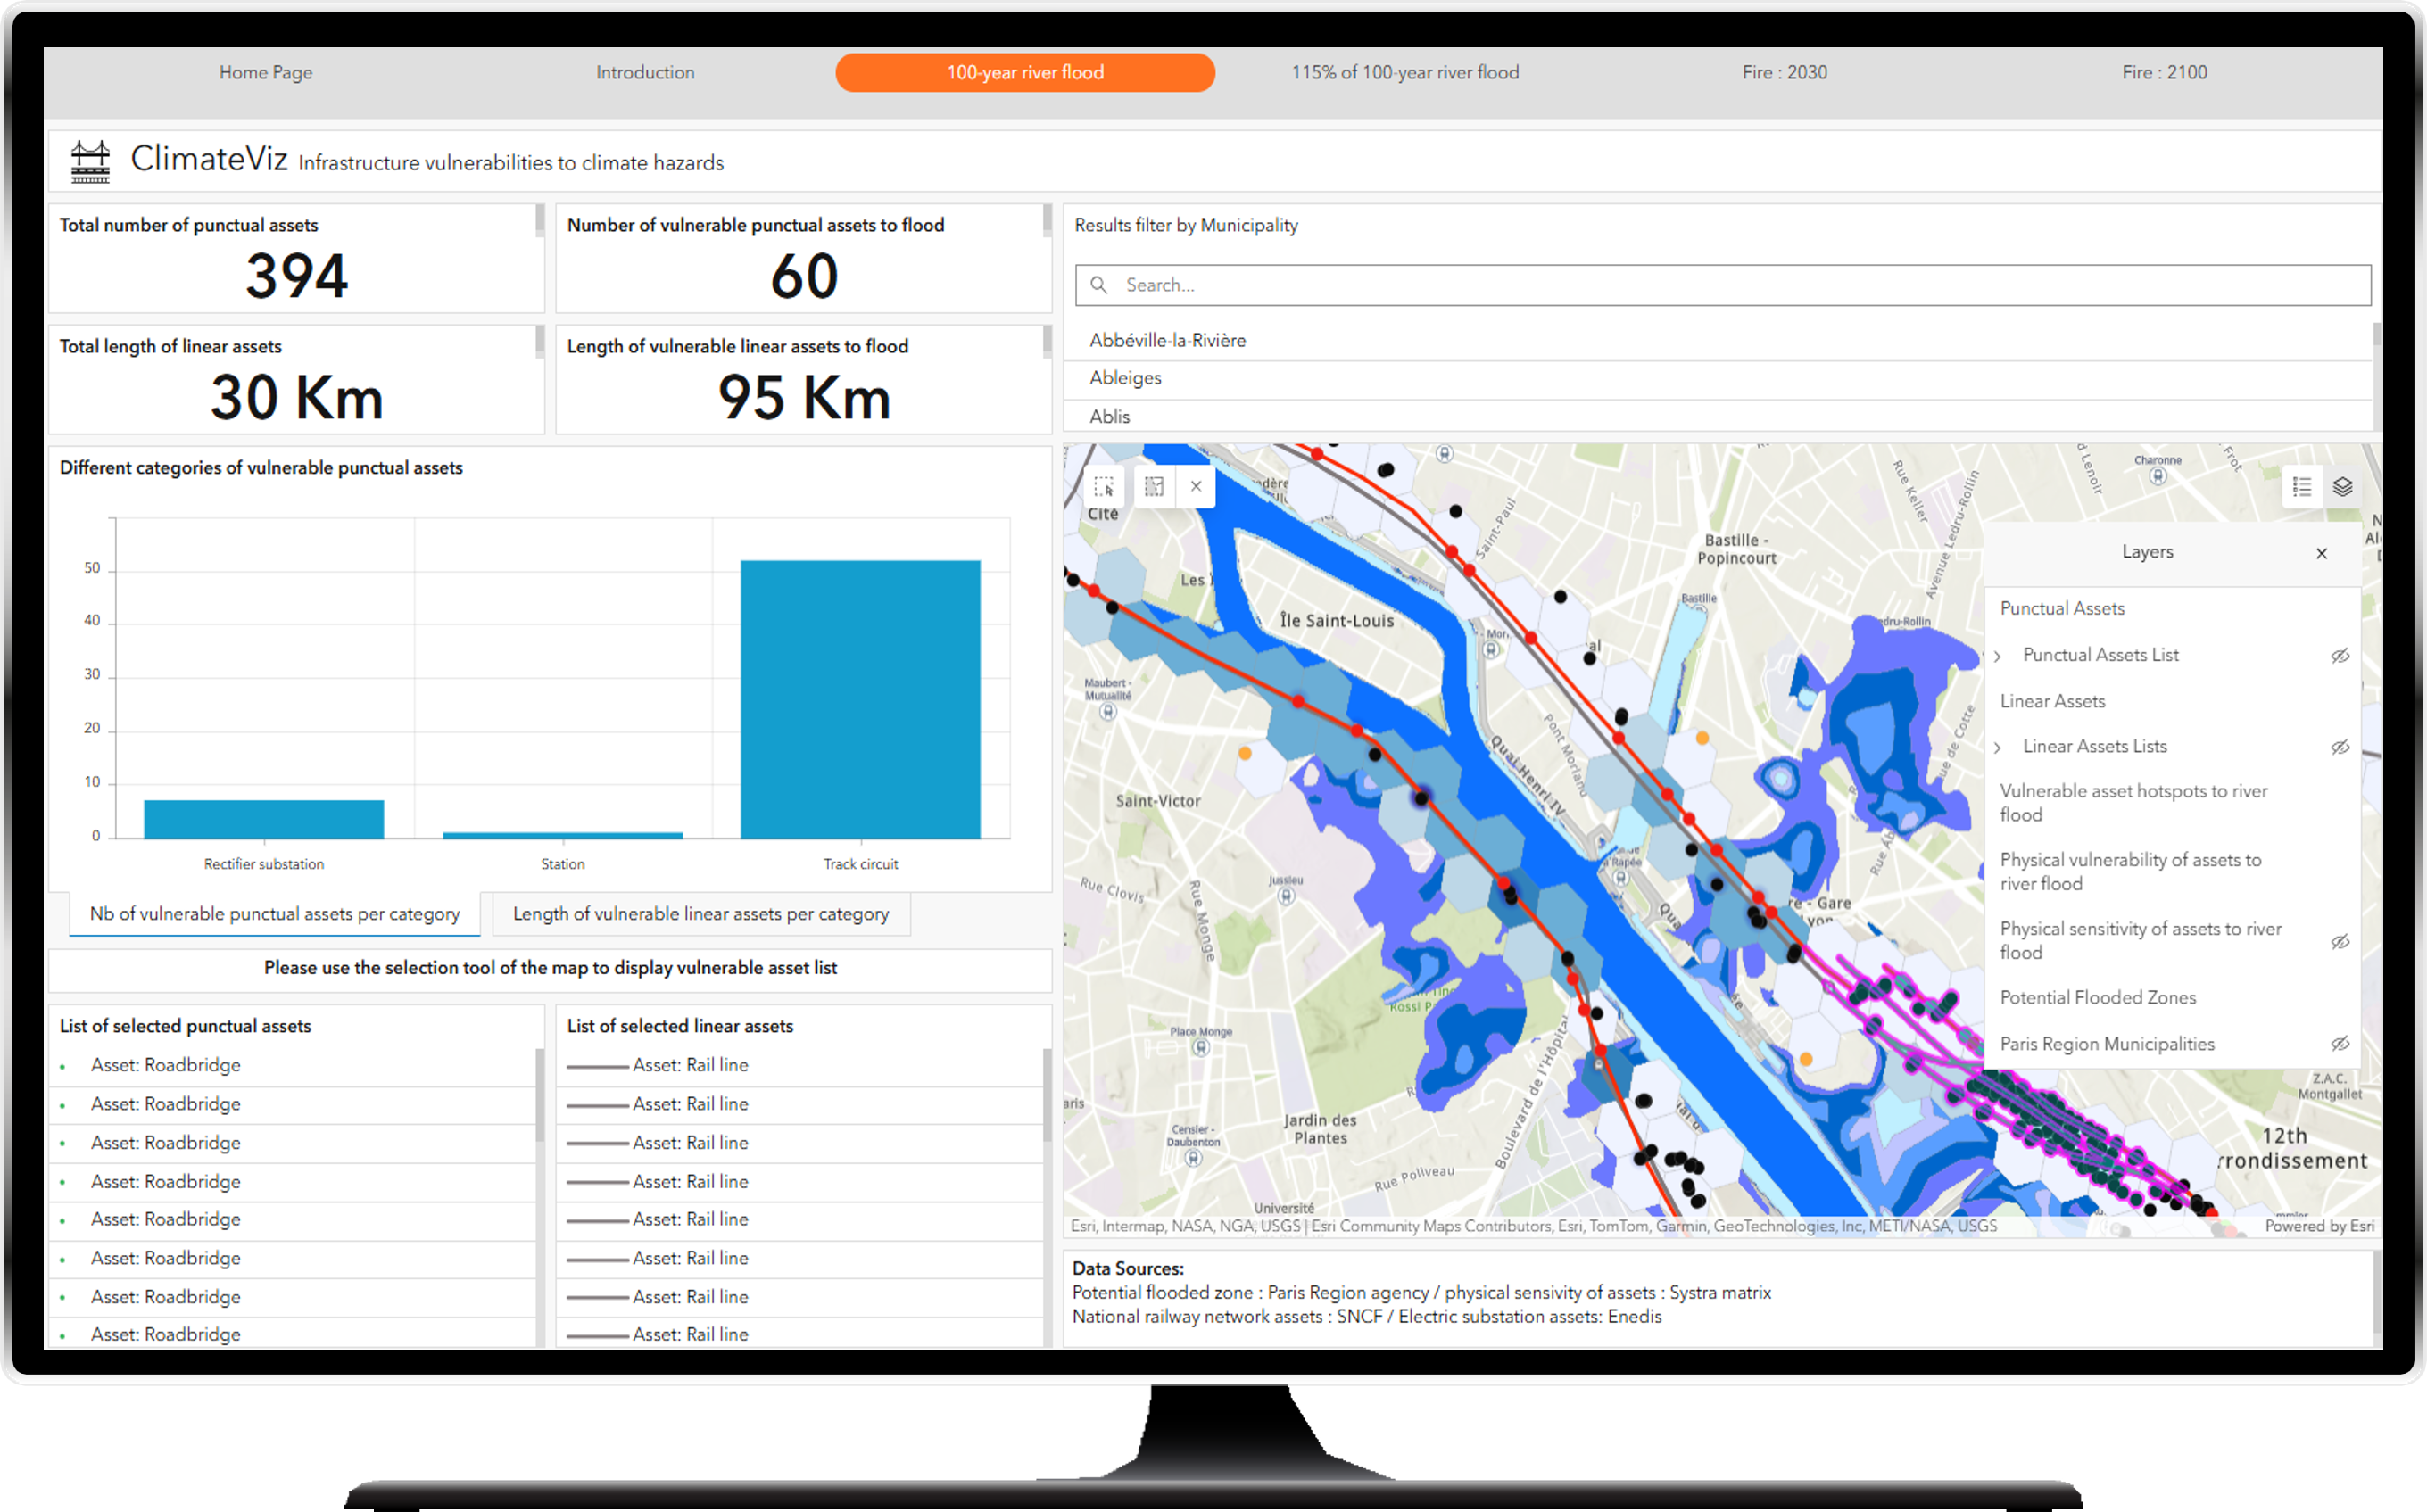
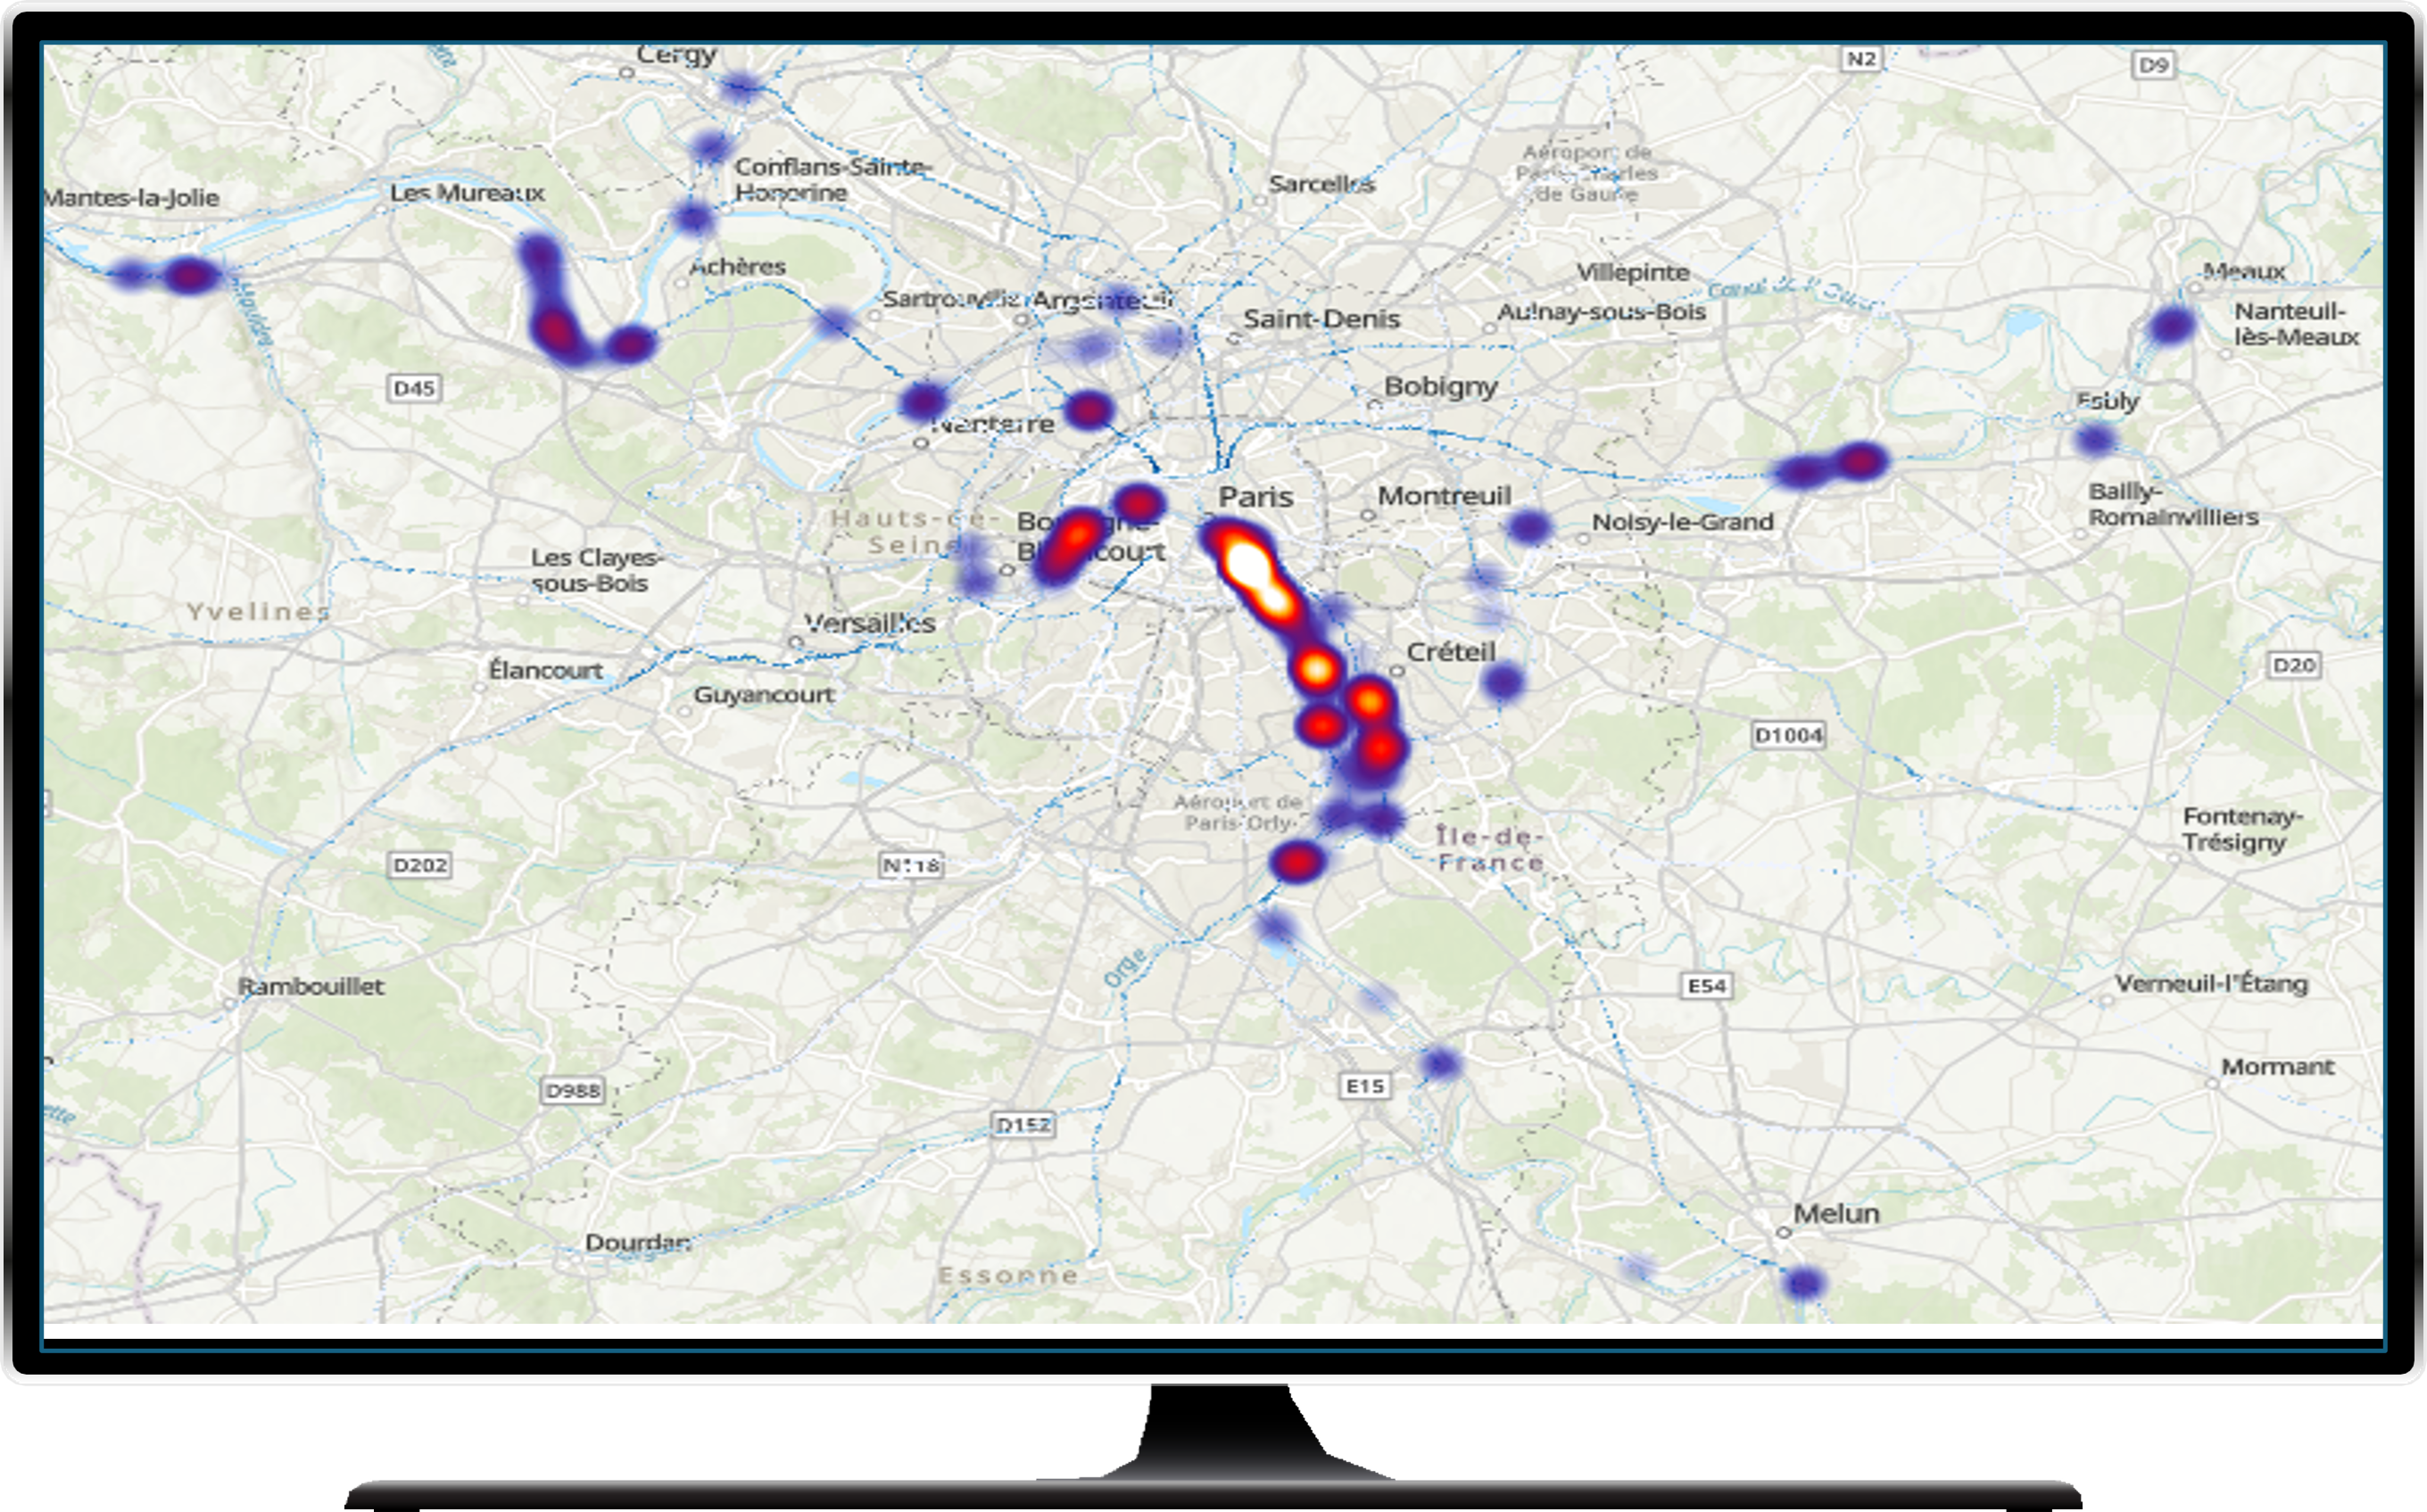
Spotlight vulnerable hotspots
- Visualise the vulnerable hotspots
- Select climate hazards: extreme temperature, heavy rain, flood, wildfire, landslide, windstorm…
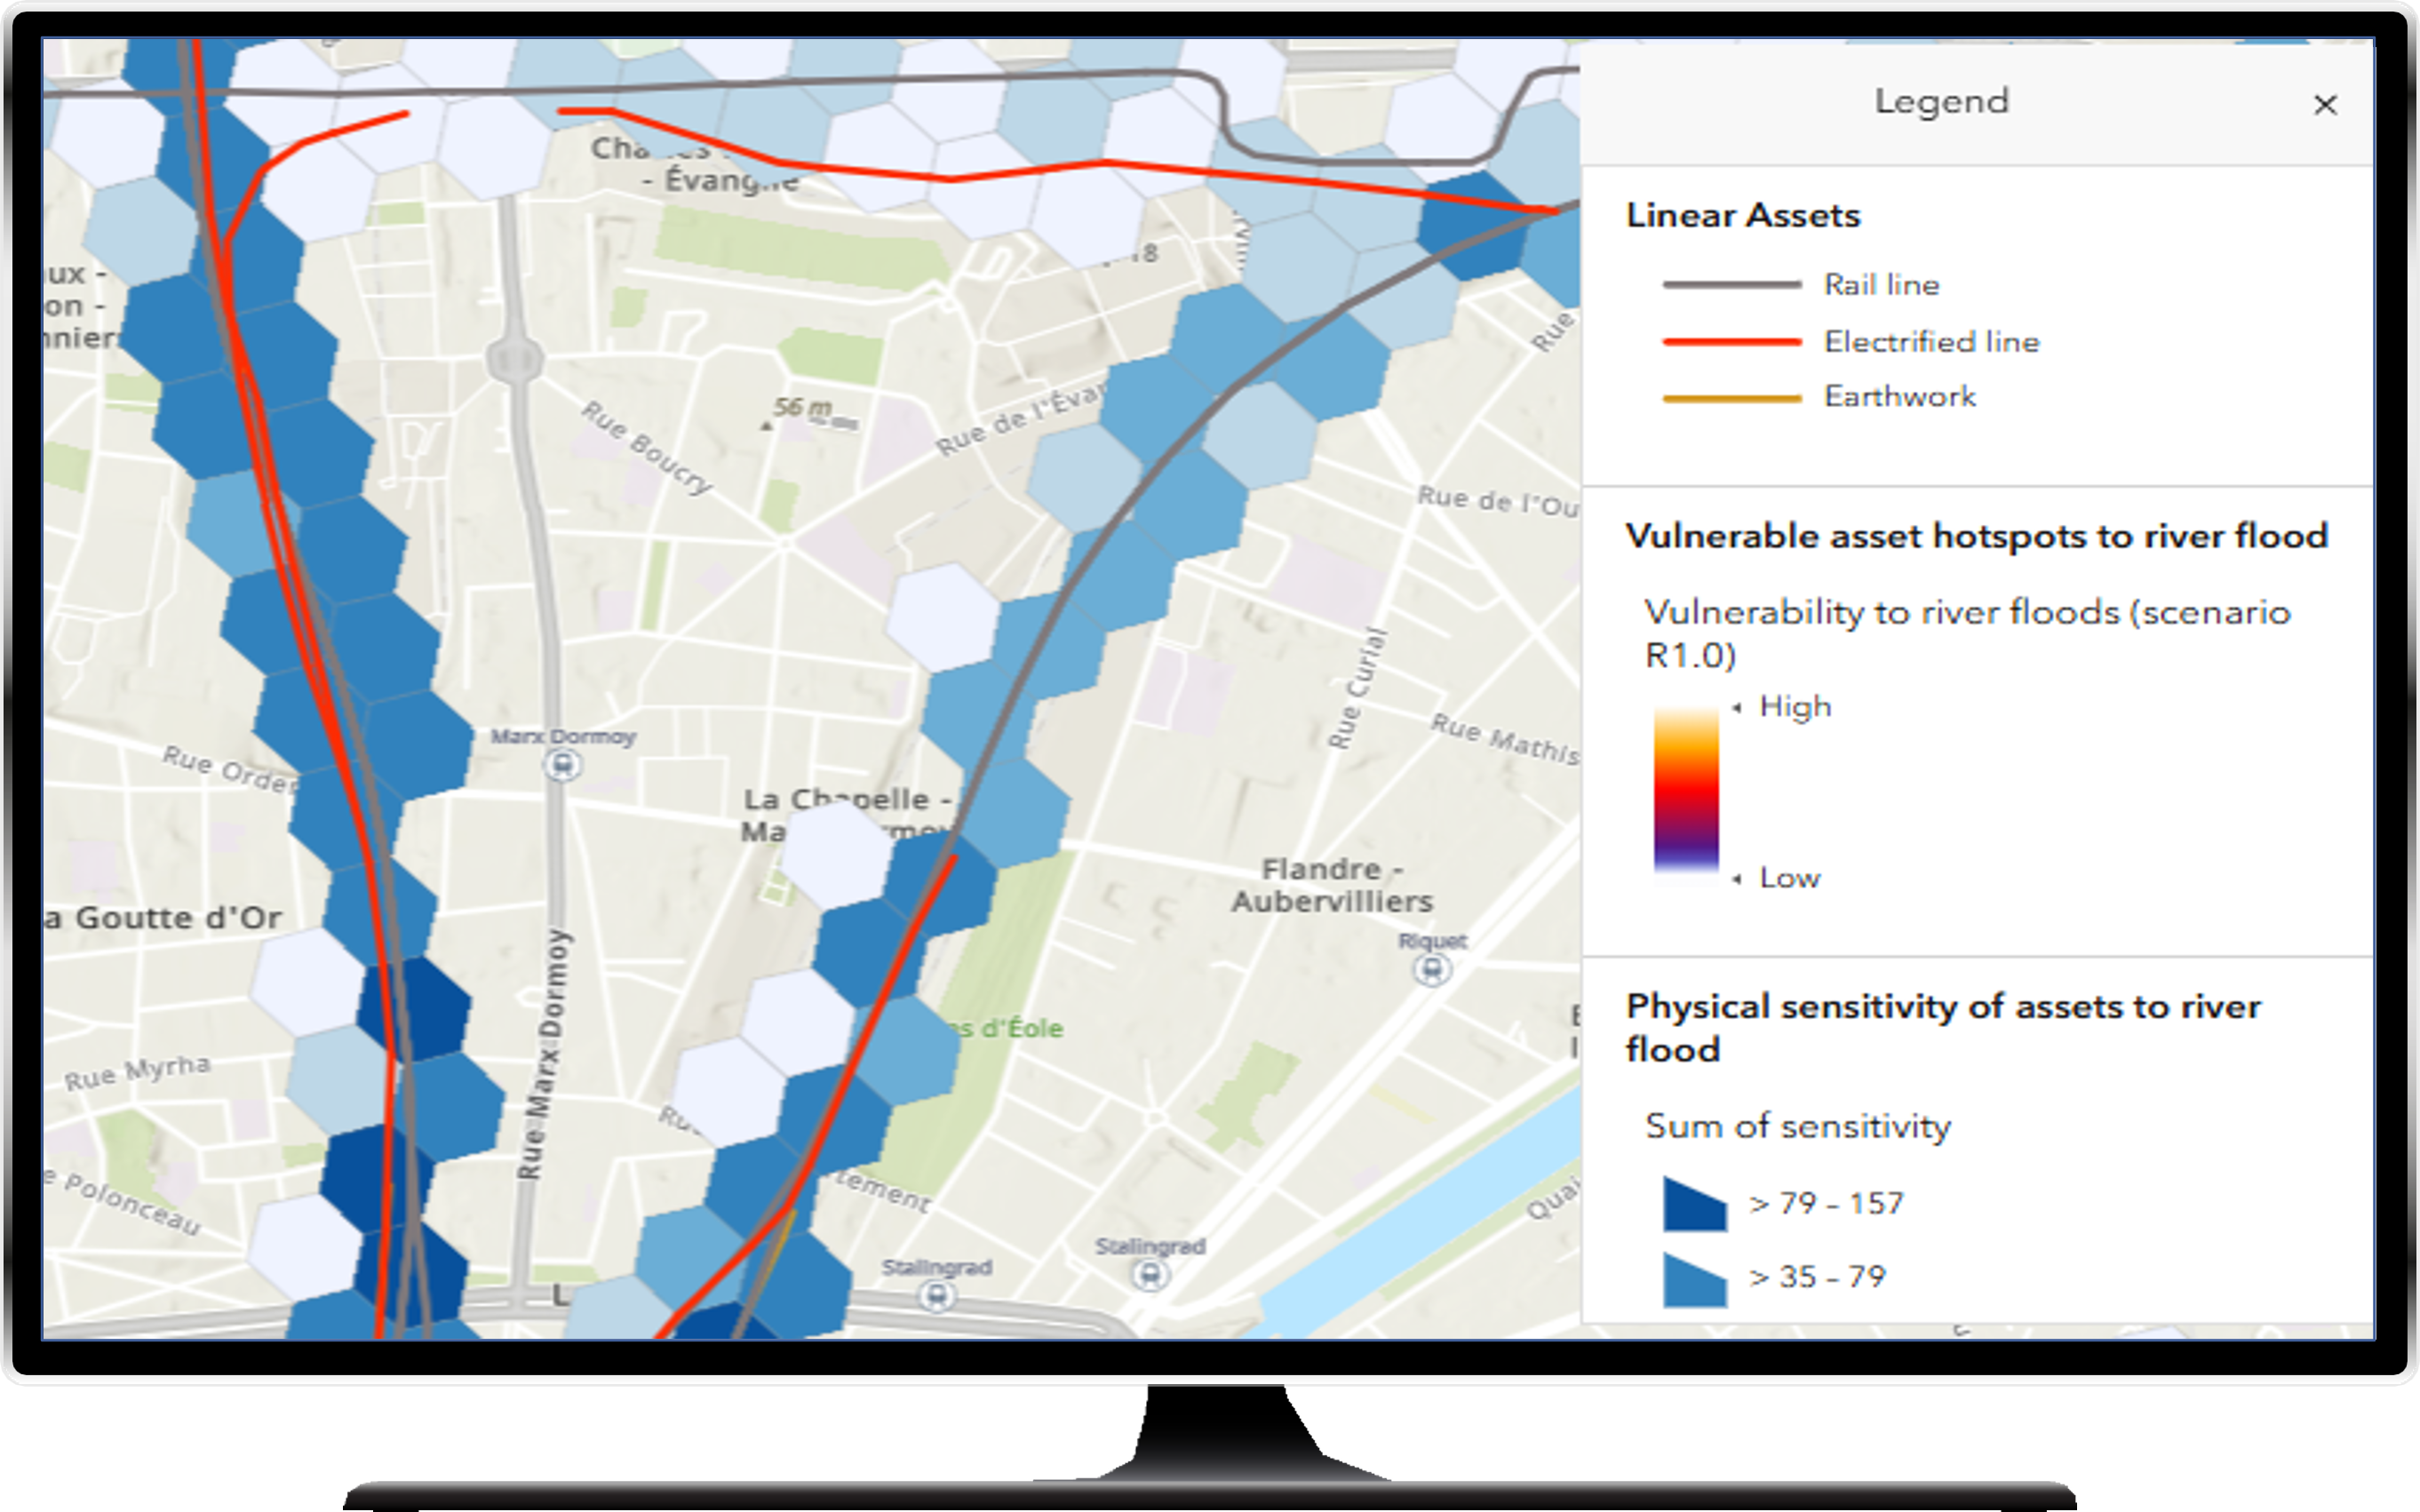
- Select the layers: asset breakdown, sensitivity, vulnerability and hotspots
Analyse vulnerability evolution
- Analyse vulnerability indicators on hotspots and assets
- Compare the climate scenarios, cross-referencing historical and projection model data
- Assess vulnerability evolution of infrastructure up to 2100
Flexible solution for every infrastructure
ClimateViz can be replicated for all linear infrastructures, all climate hazards and all geographies:
- The digital solution is based on a solid methodology with GIS layers and asset scores aggregated at a fine grid level.
Benefits
With the ClimateViz solution, you can:
- Prioritise your adaptation investments
- Identify the most vulnerable assets and hotspots of your project
- Anticipate vulnerability evolution across climate change scenarios
- Go beyond historical data using cross-referenced projection model outputs
- Support decision-making for your adaptation plan


highlighted by the Paris Region Agency, a prize won for climateviz
Hackathon on climate change data visualisation
- 3-week competition
- 15 competitors
- 2nd prize for SYSTRA

Contact systra’s experts
Request information or a demo!